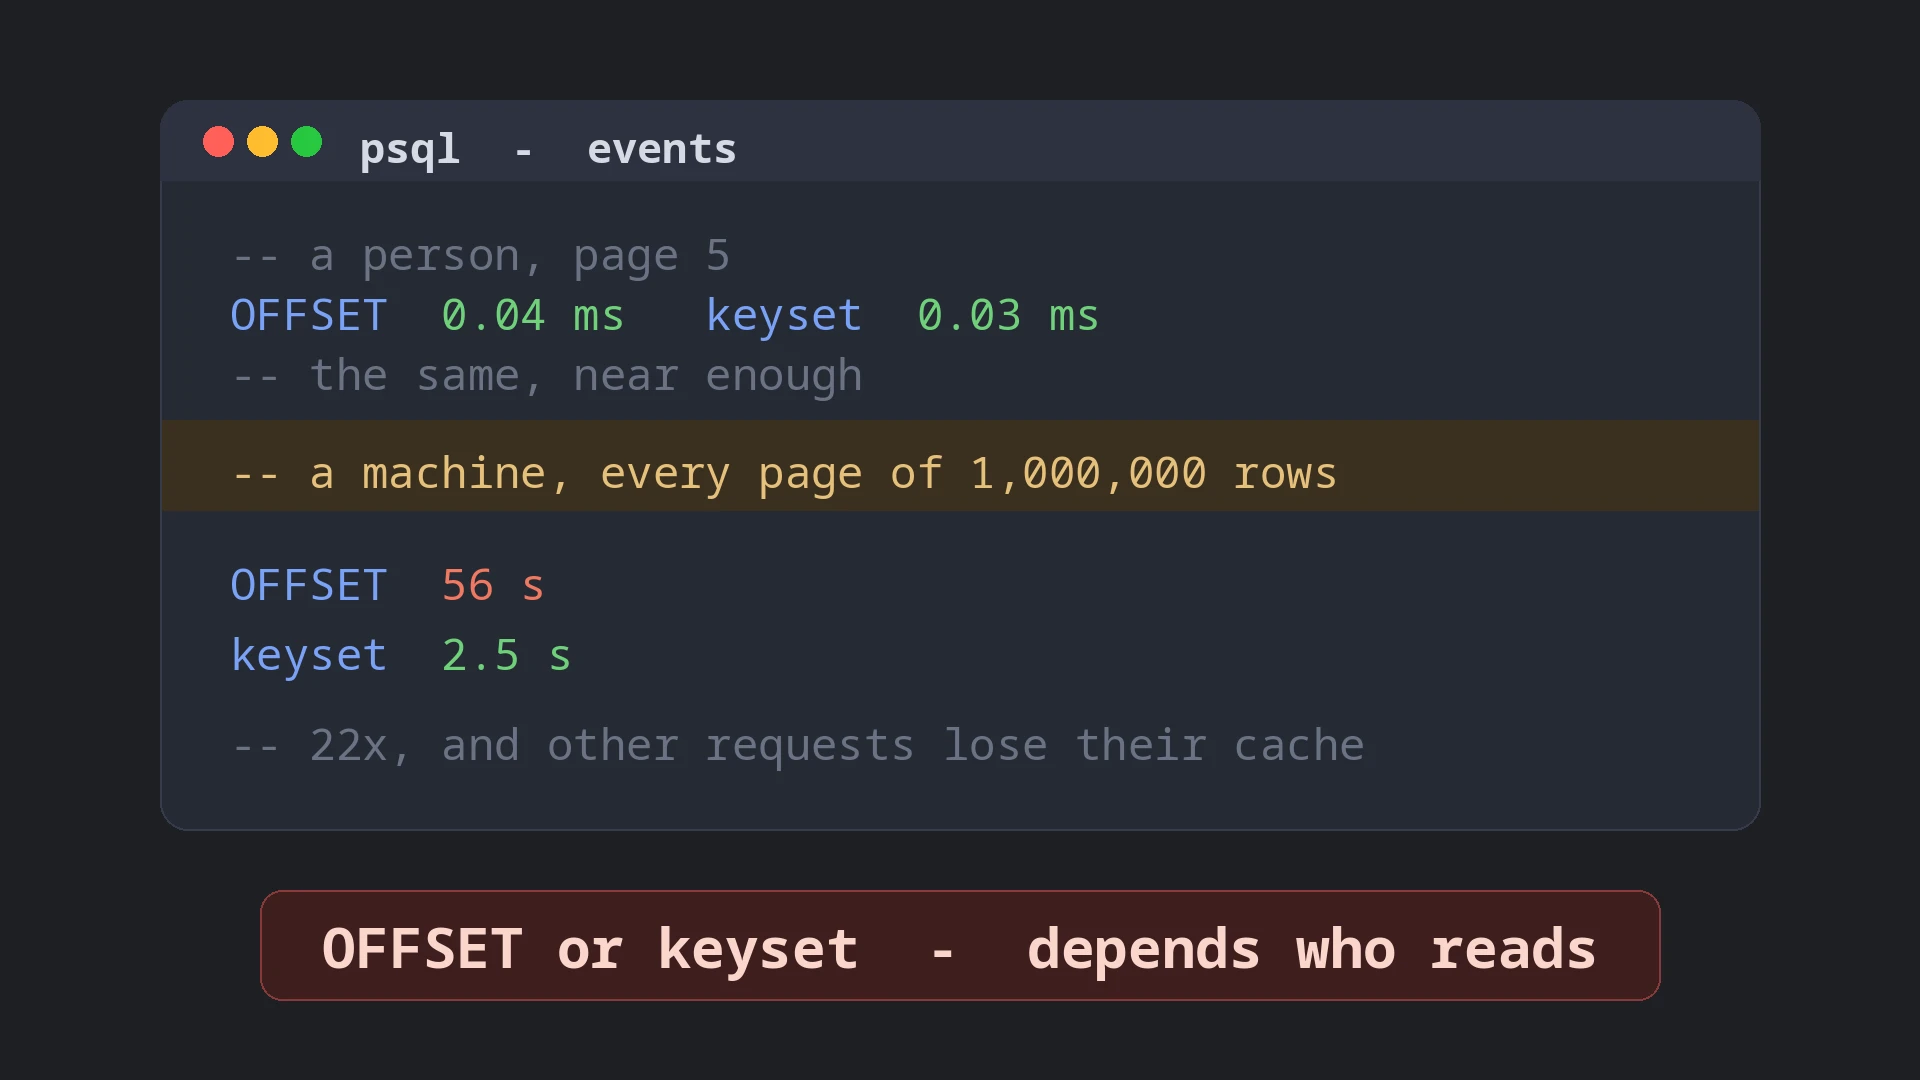
OFFSET or keyset? It depends who is reading
Every discussion of pagination seems to end the same way: LIMIT ... OFFSET is slow, use keyset pagination. Measured, the honest answer is less tidy. It depends on who is reading the pages. A person paging through a screen and a machine reading all of them are asking two different questions, and the two strategies answer them very differently.
In short
For a person clicking through the first pages of a screen, OFFSET and keyset cost the same, and keyset's extra design work does not pay for itself. For a machine reading every page, an export, a sync or another service, OFFSET's cost grows with the square of the table, it pushes other requests' data out of the cache, and it repeats rows when the data changes underneath it.
- pages 1 to 11: 4-10 vs 4-5 buffers
- every page of 1M rows: 56 s vs 2.5 s
- other requests' data kept in cache: 85% vs 100%
- rows an export repeated: 6,609 vs 0
Two ways to ask for the same page
A table of events, newest first, twenty to a page. Here is page 51, asked both ways:
LIMIT / OFFSET
SELECT * FROM events
ORDER BY created_at DESC,
         id DESC
LIMIT 20 OFFSET 1000;
Counts past the first 1,000 rows, then returns the next 20. Needs nothing but the page number.
Keyset
SELECT * FROM events
WHERE (created_at, id) <
      ('2026-09-03 21:22:30+02',
       999001)
ORDER BY created_at DESC,
         id DESC
LIMIT 20;
Starts right after the last row the client showed, which it has to remember: here row 1,000.
Both return the same twenty rows, and both use the same index on (created_at DESC, id DESC). The difference is how they find where the page starts. OFFSET walks the index from the top and throws away every row it counts past. Keyset asks the index to start at the remembered row.
The test table has 1,000,000 events, four to a second, so created_at alone has ties and id is there to break them. Details are at the end.
A person, page by page
Most people who open a list look at the first page, some at the second, few past the tenth. Here is what pages 1 to 11 cost:
Pages 1 to 11: buffers each page touched
One page of 20, the way a person clicks through a screen. A buffer is one 8 kB page, here already in memory: ten of them take a few hundredths of a millisecond.
Deeper in: time to fetch one page
Median of 3 runs of 5. Logarithmic scale: each line up is ten times slower.
On the first eleven pages OFFSET touched 4 to 10 buffers (8 kB pages of table or index) and took 0.03 to 0.06 ms. Keyset touched 4 or 5 and took 0.03 ms. The gap is a few hundredths of a millisecond per page, far below anything a person, or the network between them and the database, would notice.
They part further in. OFFSET reads every row it skips, so its cost grows with the page number: 0.15 ms on page 51, 1.2 ms on page 501, 12.8 ms and 3,512 buffers on page 5,001. The very last page, 999,980 rows in, took 187 ms and touched 35,084 buffers, more than twice the whole of shared_buffers, to return 20 rows. Keyset stayed at 4 or 5 buffers and a few hundredths of a millisecond at every depth. But nobody clicks “next” five thousand times.
| Page | Rows skipped | LIMIT / OFFSET | Keyset | ||||
|---|---|---|---|---|---|---|---|
| time | rows read | buffers | time | rows read | buffers | ||
| 1 | 0 | 0.03 ms | 20 | 4 | 0.03 ms | 20 | 4 |
| 11 | 200 | 0.06 ms | 220 | 10 | 0.03 ms | 20 | 4 |
| 51 | 1,000 | 0.15 ms | 1,020 | 38 | 0.03 ms | 20 | 4 |
| 501 | 10,000 | 1.2 ms | 10,020 | 355 | 0.04 ms | 20 | 5 |
| 5,001 | 100,000 | 13 ms | 100,020 | 3,512 | 0.04 ms | 20 | 4 |
| 25,001 | 500,000 | 83 ms | 500,020 | 17,544 | 0.04 ms | 20 | 4 |
| 50,000 | 999,980 | 187 ms | 1,000,000 | 35,084 | 0.03 ms | 20 | 4 |
What keyset asks for in return
The speed is only one side. Keyset pagination costs design work that OFFSET does not:
- A unique tiebreaker.
created_atalone has four rows a second here. Page on it alone and a page boundary that falls inside a second repeats or loses rows. The cursor has to include something unique, hereid. - An index per sort order. A screen that sorts by date, by amount and by customer needs three indexes, each ending in the tiebreaker, and three kinds of cursor.
- No jumping. “Go to page 37” has no keyset equivalent. There is next and previous, from where you are.
- State in the client. The cursor travels with every request and has to be kept, encoded and validated.
- Sharp edges. A nullable sort column silently drops the rows where it is NULL, and mixing ascending and descending columns rules out the simple row comparison.
OFFSET has none of these: any sort the user picks, any page number, no state. For a person who stays in the first pages, keyset buys almost nothing and costs all of the above.
When the data moves
One more difference shows up even at page 2. Load page 1, then let a new event arrive, or let one the reader already saw be deleted, and load page 2:
LIMIT / OFFSET
A row arrives: page 2 opens with 1 row the reader already saw.
A row they saw is deleted: 1 row is never shown.
Keyset
Repeated 0, skipped 0. Page 2 is "after the last row you saw", and that row has not moved.
OFFSET counts rows. One more row in front of the window pushes everything down by one, one fewer pulls it up by one. For a person that is an annoyance: a card shown twice in a feed, or one they never see. It rarely gets reported.
A machine, every page
Now the other reader. An export, a nightly sync, another service copying the data, a batch job: they read every page, in order, usually in bigger pages, here 1,000 rows. The question stops being “what does page 51 cost” and becomes “what does the whole walk cost”.
Reading every page: time against the size of the table
Pages of 1,000, in order, server-side. Median of 3 walks.
On 100,000 rows the difference is still small: OFFSET reads every page in 0.6 s, keyset in 0.2 s. On a million rows OFFSET takes 56 s and reads 501 million rows to deliver 1 million; keyset takes 2.5 s and reads each row once. OFFSET’s last page alone touched 35,084 buffers. Keyset’s last page touched 39, the same as its first:
Every page of 1,000,000 rows: buffers each page touched, in order
Page 1 on the left, page 1,000 on the right.
Page k with OFFSET reads the k - 1 pages before it again. Over the whole walk that adds up to about half the table times the number of pages, so ten times the rows means about a hundred times the work. Keyset reads each row once.
The usual advice for making OFFSET cheaper is the deferred join: skip over the index alone, then fetch only the page’s rows by key. It helps, 25 s instead of 56 on the full table, with a third of the buffers. It does not change the shape: it still reads 502 million index entries, because skipping still means counting. It also depends on the plan. On 100,000 rows the planner joined back with a hash join over the whole table, and the walk took twice as long as plain OFFSET. On the first pages a person sees, it touches about twenty times the buffers plain OFFSET does.
| Every page of | LIMIT / OFFSET | Deferred join | Keyset | |||||
|---|---|---|---|---|---|---|---|---|
| time | rows read | buffers | time | buffers | time | rows read | buffers | |
| 100k rows | 0.6 s | 5,150,000 | 180,959 | 1.2 s | 329,491 | 0.2 s | 100,000 | 3,886 |
| 300k rows | 3.8 s | 45,450,000 | 1,595,313 | 2.8 s | 1,371,220 | 0.7 s | 300,000 | 11,652 |
| 1M rows | 55.8 s | 501,500,000 | 17,596,205 | 25.2 s | 5,920,987 | 2.5 s | 1,000,000 | 38,834 |
Other requests notice
A walk like this does not run alone. While it reads, the same database answers ordinary requests, and they all share one cache, PostgreSQL’s shared_buffers. To see whether they notice, a stream of primary-key lookups ran against a table of their own, loaded into the cache first and small enough to stay there: alone, beside a machine walking events with OFFSET, and beside one using keyset. Who held the cache was sampled once a second while each round ran.
nothing else running
of their table held in shared_buffers while it ran (100% over 3 rounds,
the lowest second 100%). p95 0.043 ms, 126,029 lookups a second.
beside an OFFSET walker
of their table held in shared_buffers while it ran (82%–85% over 3 rounds,
the lowest second 75%). p95 0.061 ms, 96,969 lookups a second.
beside a keyset walker
of their table held in shared_buffers while it ran (100% over 3 rounds,
the lowest second 100%). p95 0.052 ms, 107,516 lookups a second.
Beside the OFFSET walker, the lookups’ table held 82 to 85% of its pages while both ran, and at the worst second 75%. Beside the keyset walker it held all of them. Second by second, it looks like a tug of war: the walker pushes their pages out, the lookups pull them back, and it settles at the share the walker leaves them:
Their table's share of shared_buffers, once a second
First round of each, 30 s. Beside keyset, the dip in the first two seconds is the walker's head start, before the lookups begin: nothing was using their pages yet, and they came straight back.
Both walkers read the whole table, so why only OFFSET? Not because its pages get hotter: under either walker alone, the walked table’s pages sat at an average usage count of about 0.5 to 0.7. It is the misses. OFFSET re-reads the table from the top for every page, and the table is twice the size of the cache, so almost every read needs a new buffer: PostgreSQL allocated 115,887 buffers a second for the OFFSET walker, against 13,579 for keyset. Each allocation moves the cache’s clock sweep, and the sweep lowers the usage count of every buffer it passes, the lookups’ included. Eight and a half times the sweep is eight and a half times the pressure on everyone else’s pages. PostgreSQL protects its cache from large sequential scans by giving them a small ring of 256 kB to cycle through (buffer manager README); a walk through an index gets no such protection.
What the lookups felt was smaller, and it would be wrong to overstate it. Their p95 latency went from 0.043 ms alone to 0.061 ms beside the OFFSET walker and 0.052 ms beside the keyset walker, and their throughput dropped by 23% and 15%. Part of that is the walker competing for CPU, which keyset pays too. The evicted pages came back from the operating system’s own cache: this laptop has 15 GB of memory and the whole database fits in it. On a server whose data does not fit in memory, or whose storage is a network disk, those pages would come from storage instead. That case was not measured here.
When the data moves during an export
The row repeated on page 2 is an annoyance for a person. For a machine it is a wrong result. The same walk ran again while rows kept arriving and leaving, 200 changes a second, and every row it received was counted against the rows that existed for the whole walk:
LIMIT / OFFSET
of 992,908 rows that were there throughout, with 14,208 rows inserted or deleted during the walk (medians of 3).
deferred join
of 996,001 rows that were there throughout, with 7,746 rows inserted or deleted during the walk (medians of 3).
keyset
of 999,001 rows that were there throughout, with 1,923 rows inserted or deleted during the walk (medians of 3).
OFFSET repeated 6,609 rows (median of three walks) and missed 9 of the roughly 993,000 that were there throughout. The deferred join repeated 3,644 and missed 3. Keyset repeated none and missed none, in every walk.
Almost every row that arrived at the top during the walk became a duplicate further down, because it pushed every later page back by one. Deleting a row the walker had already passed pulls the window the other way and makes it skip one, so the two partly cancel: that is why misses are rare here and duplicates are not. The slow walk also makes it worse: OFFSET’s walks took 70 to 87 seconds and saw about 7,000 new rows, keyset’s took 13 seconds and saw about 1,000. An export that must contain every row exactly once cannot use OFFSET while the table is being written to.
So which one?
Side by side, the case for each, whoever is reading:
LIMIT / OFFSET
For
- Jumps straight to any page: page 500 is one query, no state.
- Works with any ORDER BY, including one the user picks at run time.
- A total page count is the same count(*) you already wanted.
- Trivial to write, and every framework generates it for you.
Against
- Cost grows with depth: the server reads every skipped row and discards it.
- Rows repeat or vanish when the data changes between two page requests.
- The deepest pages are the slowest, and nobody notices in testing because testing looks at page one.
Keyset
For
- Constant cost at any depth: the index is asked where to start.
- Stable while the data moves - a page is defined by the last row you saw, not by how many rows are in front of it.
- Reads exactly the page size, so the buffer count stops being a function of how far in the user has gone.
Against
- No jumping. You can go next and previous, not to page 500.
- Needs a total order: the sort column plus something unique to break ties.
- Every sort the user can choose needs its own index and its own cursor.
- Row comparison wants one direction - mixed ASC/DESC needs writing out by hand, and NULLs in the sort column will silently skip rows.
- The cursor is state the client has to carry.
Which of those lines matter depends on the reader:
| Who reads the pages | What matters | Pick |
|---|---|---|
| A person, a screen with page numbers and a choice of sort | Jumping to a page, any sort order, simple code | OFFSET, with a cap on how deep it goes |
| A person, an endless feed or "load more" | No repeats while new items arrive | Keyset, it fits the interaction anyway |
| A machine: an export, a sync, an API other services walk | Every row exactly once, cost that does not grow with depth, leaving the cache to others | Keyset |
| An admin grid over a small table | Nothing, really | OFFSET |
The two also combine well: page numbers for the first pages a person will actually visit, and a cap beyond them (“refine your search”), with keyset behind any endpoint a machine is going to walk.
Your framework already chose
Most code does not write either query by hand. In Spring Data, a repository method that takes a Pageable and returns a Page generates OFFSET, plus a count(*) over the whole result for the page total. Returning a Slice drops the count, not the OFFSET. Keyset is there too, since Spring Data 3.1: ScrollPosition.keyset() and a Window result. Which one an endpoint uses is worth deciding on purpose, by asking who will call it.
No technology fixes bad design, it only mitigates it. Neither pagination is the good one. They answer different questions, and the design decision is knowing which question your reader is asking.
Try it yourself
Two scripts reproduce every number above. The first needs only psql; it builds the table (about 300 MB), measures one page at every depth, shows the data moving under page 2, and walks every page three ways on 100,000, 300,000 and 1,000,000 rows. It takes about five minutes on this laptop, most of it OFFSET.
curl -O https://constantine2nd.github.io/assets/sql/offset-vs-keyset.sql
curl -O https://constantine2nd.github.io/assets/sql/offset-vs-keyset-concurrent.sh
createdb pagination_demo
psql -X -d pagination_demo -f offset-vs-keyset.sql
bash offset-vs-keyset-concurrent.sh pagination_demo
dropdb pagination_demo
The second needs pgbench and runs the two experiments that need two sessions at once: other requests beside a walker, and a walk while rows change. It creates the pg_prewarm and pg_buffercache extensions to load and count the cache. psql -X skips your personal ~/.psqlrc; add -h <host> -U <user> if your PostgreSQL is not local.
Measurement details
| Machine | Laptop, 11th Gen Intel(R) Core(TM) i7-11390H @ 3.40GHz (8 threads), 15 GB RAM, NVMe SSD, Linux; CPU governor powersave |
| PostgreSQL | 14.24, default settings (shared_buffers 128MB), local Unix-socket connection |
| Table | 1,000,000 rows, 244 MB plus 52 MB of indexes; created_at has four rows a second, so ties are real |
| One page | Page of 20; EXPLAIN (ANALYZE, BUFFERS), median of 5 runs after one not counted, three such runs; rows read is every row the plan’s scans produced, skipped ones included |
| Every page | Pages of 1,000, in order, until one comes back short, in a PL/pgSQL loop (server-side: no network); time from running each page with every column turned into text, median of 3 walks; buffers and rows read from EXPLAIN of each page |
| Other requests | Primary-key lookups, 4 clients, 30 s, on a 7,009-page table loaded into shared_buffers first; pg_buffercache sampled once a second during each round; medians of 3 rounds, interleaved; measured 2026-10-02 |
| Moving data | pgbench writer, 200 changes a second (half new rows at the top, half random deletes), 5 ms pause between pages |
| Measured | 2026-09-30; the two scripts above reproduce every number |
Corrected on 2 October 2026. The first version said the lookups' table kept 56% of its pages beside the OFFSET walker. That was counted just after the lookups stopped, with the walker still running, when nothing pulls their pages back and the walker clears them fast. Sampled once a second while both ran, the share is 82 to 85%. The direction and the conclusion are unchanged; the size was overstated. The section above is re-measured, with the cache sampled during every round, and now explains why it happens.