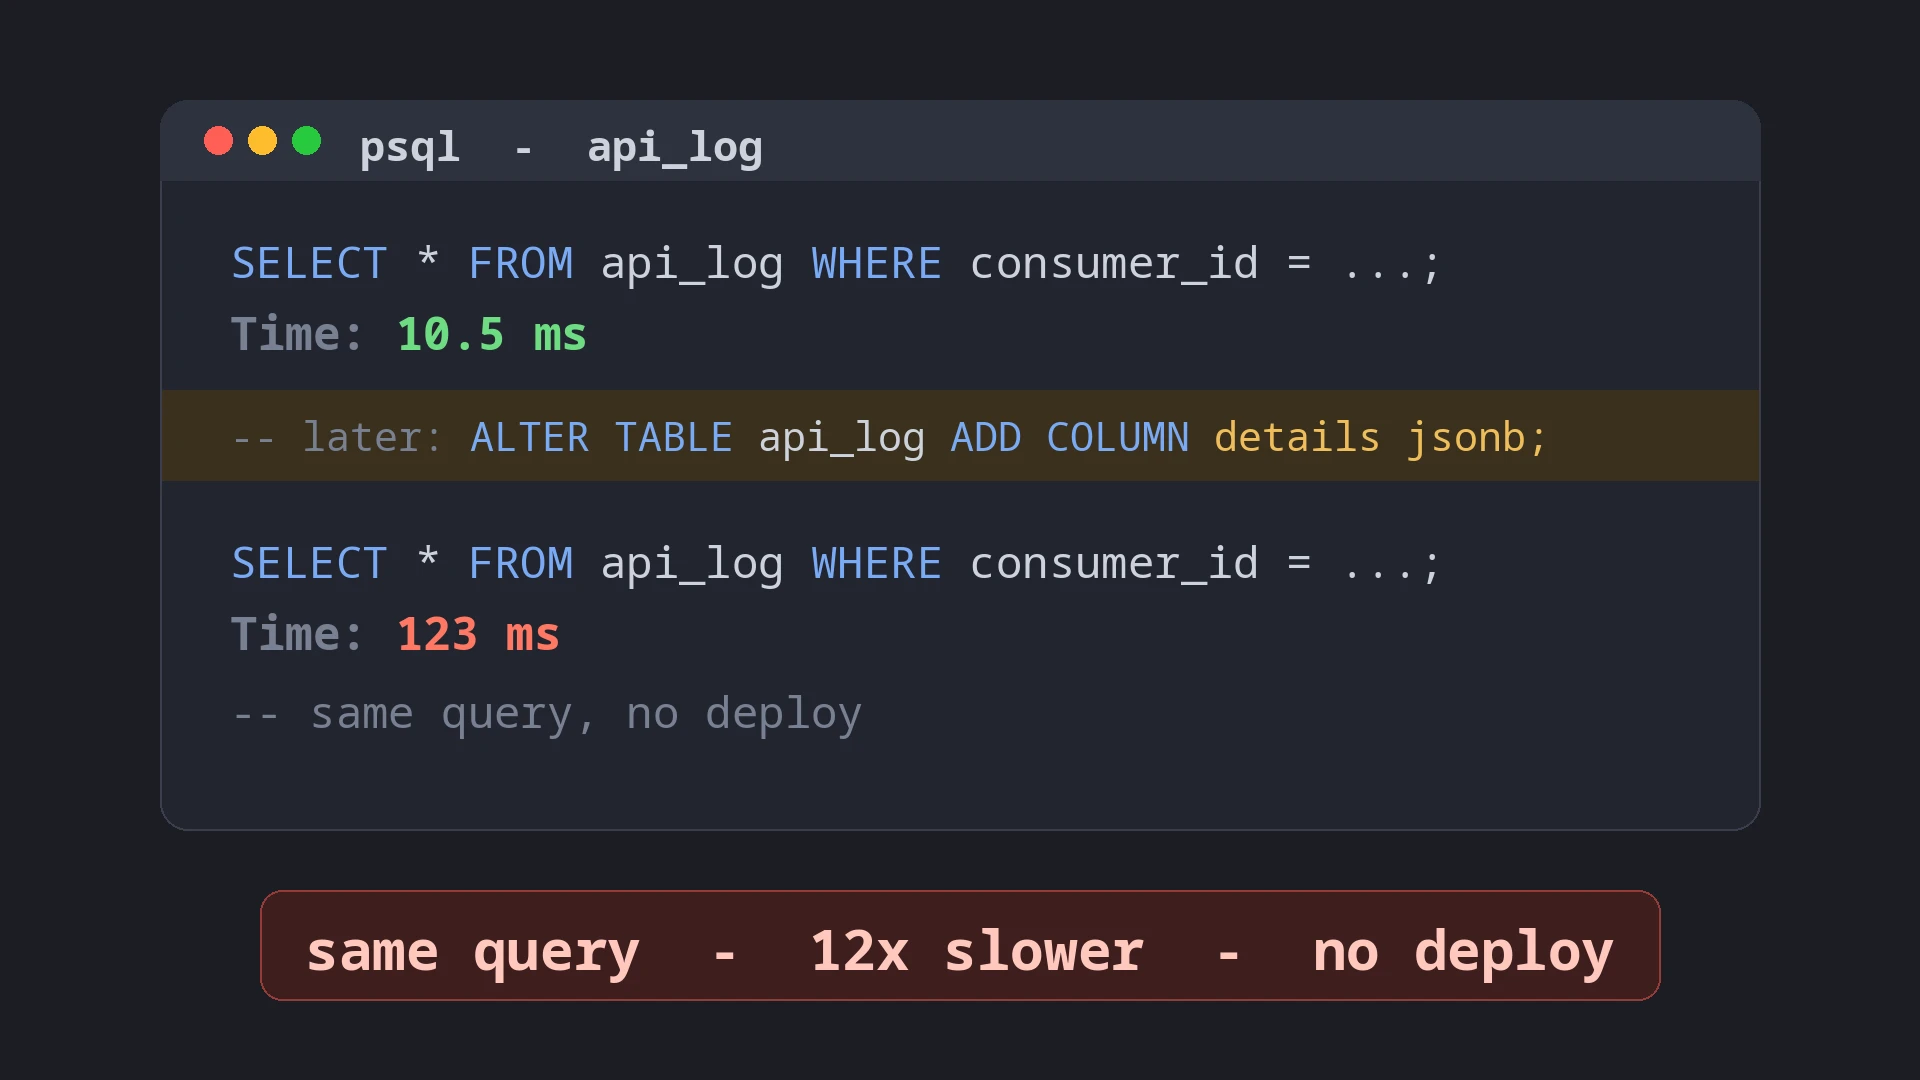
SELECT *: the slowdown that ships without a deploy
A query took 10 milliseconds. Months later the same query takes 123. Nobody changed it, nobody deployed the service that runs it, and every test still passes.
In short
The cost of SELECT * depends on columns that do not exist yet, so no test, review or benchmark can catch it when the code is written. A later migration that adds one wide column makes every SELECT * on that table slower, without any change to the query.
- 12× slower, same query
- 0 lines of query code changed
EXPLAIN: no visible change
What SELECT * actually promises
SELECT * does not mean “the columns I need”. It means “every column this table has at the moment the query runs”, including the ones nobody has added yet.
That is the whole problem in one sentence. On the day it ships, SELECT * and a list of the needed columns can cost exactly the same. The difference arrives later, with someone else’s migration.
The experiment
A table of API calls: 30 days, one row every 6 seconds, 432,000 rows, eight narrow columns. A screen shows one consumer’s calls for the last 30 days, about 10,800 rows:
SELECT * FROM api_log
 WHERE consumer_id = 'consumer-3' AND created_at >= now() - interval '30 days'
 ORDER BY created_at DESC;
Months later, a new feature needs the request and response of every call, and a migration adds them:
ALTER TABLE api_log ADD COLUMN details jsonb; -- about 2 kB per row
The query above is not touched. Then the same two queries run again, the SELECT * and one listing the six columns the screen shows, with every row sent to the client:
SELECT *
About 12× slower. It now reads, decodes and sends 10,800 JSON documents the screen never shows.
The 6 needed columns
Unchanged. It does not notice the new column at all.
Median time, before and after the migration
Before the migration the two queries cost the same, so nothing warned anyone. The table meanwhile grew from 52 MB to 1.2 GB. Over a real network, sending 21 MB instead of 1 MB per request widens the gap further.
Why EXPLAIN ANALYZE did not see it
Anyone investigating a slow query reaches for EXPLAIN ANALYZE. Here it reported 7-10 ms before the migration and 8-10 ms after. The slowdown was invisible to it. Same plan, a few more pages, a couple of milliseconds (one run of each):
Before the migration
Sort
  -> Bitmap Heap Scan on api_log
       -> Bitmap Index Scan on
          api_log_consumer_created
Buffers: shared hit=6699
Execution Time: 7.8 ms
After the migration
Sort
  -> Bitmap Heap Scan on api_log
       -> Bitmap Index Scan on
          api_log_consumer_created
Buffers: shared hit=7504
Execution Time: 10.2 ms
PostgreSQL stores large values like these 2 kB documents outside the row, in a separate TOAST table: here 1.1 GB of the 1.2 GB. The row itself only holds a pointer. EXPLAIN ANALYZE runs the query but throws the rows away without sending them, so it never follows those pointers. The expensive part only happens when rows are actually delivered.
PostgreSQL 17 added EXPLAIN (ANALYZE, SERIALIZE) to close exactly this gap: it fetches and encodes the values as if sending them. On older versions, trust the timings seen by clients, or pg_stat_statements, whose execution time includes sending the rows. For the query above it recorded 111 ms while EXPLAIN ANALYZE said 19 ms.
You may not write SELECT *, your ORM might
Most code does not contain the literal SELECT *. The ORM writes the column list, from the entity mapping. That limits the damage, but not the pattern: when the new column is mapped into the entity for the new feature, every existing query that loads that entity starts carrying it too. A deploy happened, but of a different feature, and the slow query’s code did not change.
The second cost: no index-only scans
There is a quieter cost even before any migration. When every column the query needs is inside an index, PostgreSQL can answer from the index alone and never read the table (an Index Only Scan). SELECT * rules that out, because no index contains every column. For hot queries that is often the difference between a few pages and a few thousand.
What to do
- List the columns in hot paths.
SELECT *is fine for ad-hoc queries and tiny lookup tables, not for queries that run on every request. - Use projections in the ORM for list screens and APIs: a DTO or record with the fields the screen shows, not the full entity.
- Review migrations that add wide columns by asking one question: who selects this table, and how?
- Keep large payloads in their own table, one-to-one with the main row, fetched only when someone asks for them.
- Watch mean execution time over time in
pg_stat_statements, per query. A query that got slower without a deploy is exactly what it shows andEXPLAINhides.
No technology fixes bad design, it only mitigates it. SELECT * is a small design decision whose cost arrives later, on someone else’s schedule.
Try it yourself
The whole experiment is one SQL file: select-star-delayed-cost.sql. It creates its own table (about 1 GB at the end) and prints the timings before and after the migration, plus both EXPLAIN outputs. On PostgreSQL 17 or later it also runs the SERIALIZE variant.
curl -O https://constantine2nd.github.io/assets/sql/select-star-delayed-cost.sql
createdb select_star_demo
psql -X -d select_star_demo -f select-star-delayed-cost.sql
dropdb select_star_demo
createdb makes a throwaway database, psql -X runs the script there without your personal ~/.psqlrc settings, and dropdb removes everything again. Add -h <host> -U <user> to each command if your PostgreSQL is not local, for example in Docker.
Measurement details
| Machine | Laptop, Intel Core i7-11390H (4 cores / 8 threads), 16 GB RAM, NVMe SSD, Linux |
| PostgreSQL | 14, default settings (shared_buffers 128 MB), local Unix-socket connection |
| Timings | Medians of 15 runs (the script run 3 times, 5 runs per query), measured by psql \timing, rows sent to psql and discarded |
| Rows returned | 10,800 per query |
| Table size | 52 MB before, 1.2 GB after (1.1 GB of it stored out of line) |
EXPLAIN ANALYZE |
Execution time 7.1-10.2 ms before, 8.4-10.2 ms after (one run per script run) |
pg_stat_statements |
Separate run after the migration: 111 ms mean for the SELECT *, while EXPLAIN ANALYZE reported 19 ms |